RiverPulse app icon

RiverPulse

Live river flows, runnable sections, widgets and Android Auto — for kayakers.

Coming to Google Play

RiverPulse is in testing ahead of its public release. Android 8.0 or newer. Norwegian rivers only — see where the data comes from.

What it does

RiverPulse shows live discharge (m³/s) and water level for Norwegian rivers, straight from NVE's official hydrological stations — built for kayakers who decide where to paddle based on flow.

Flow at a glance

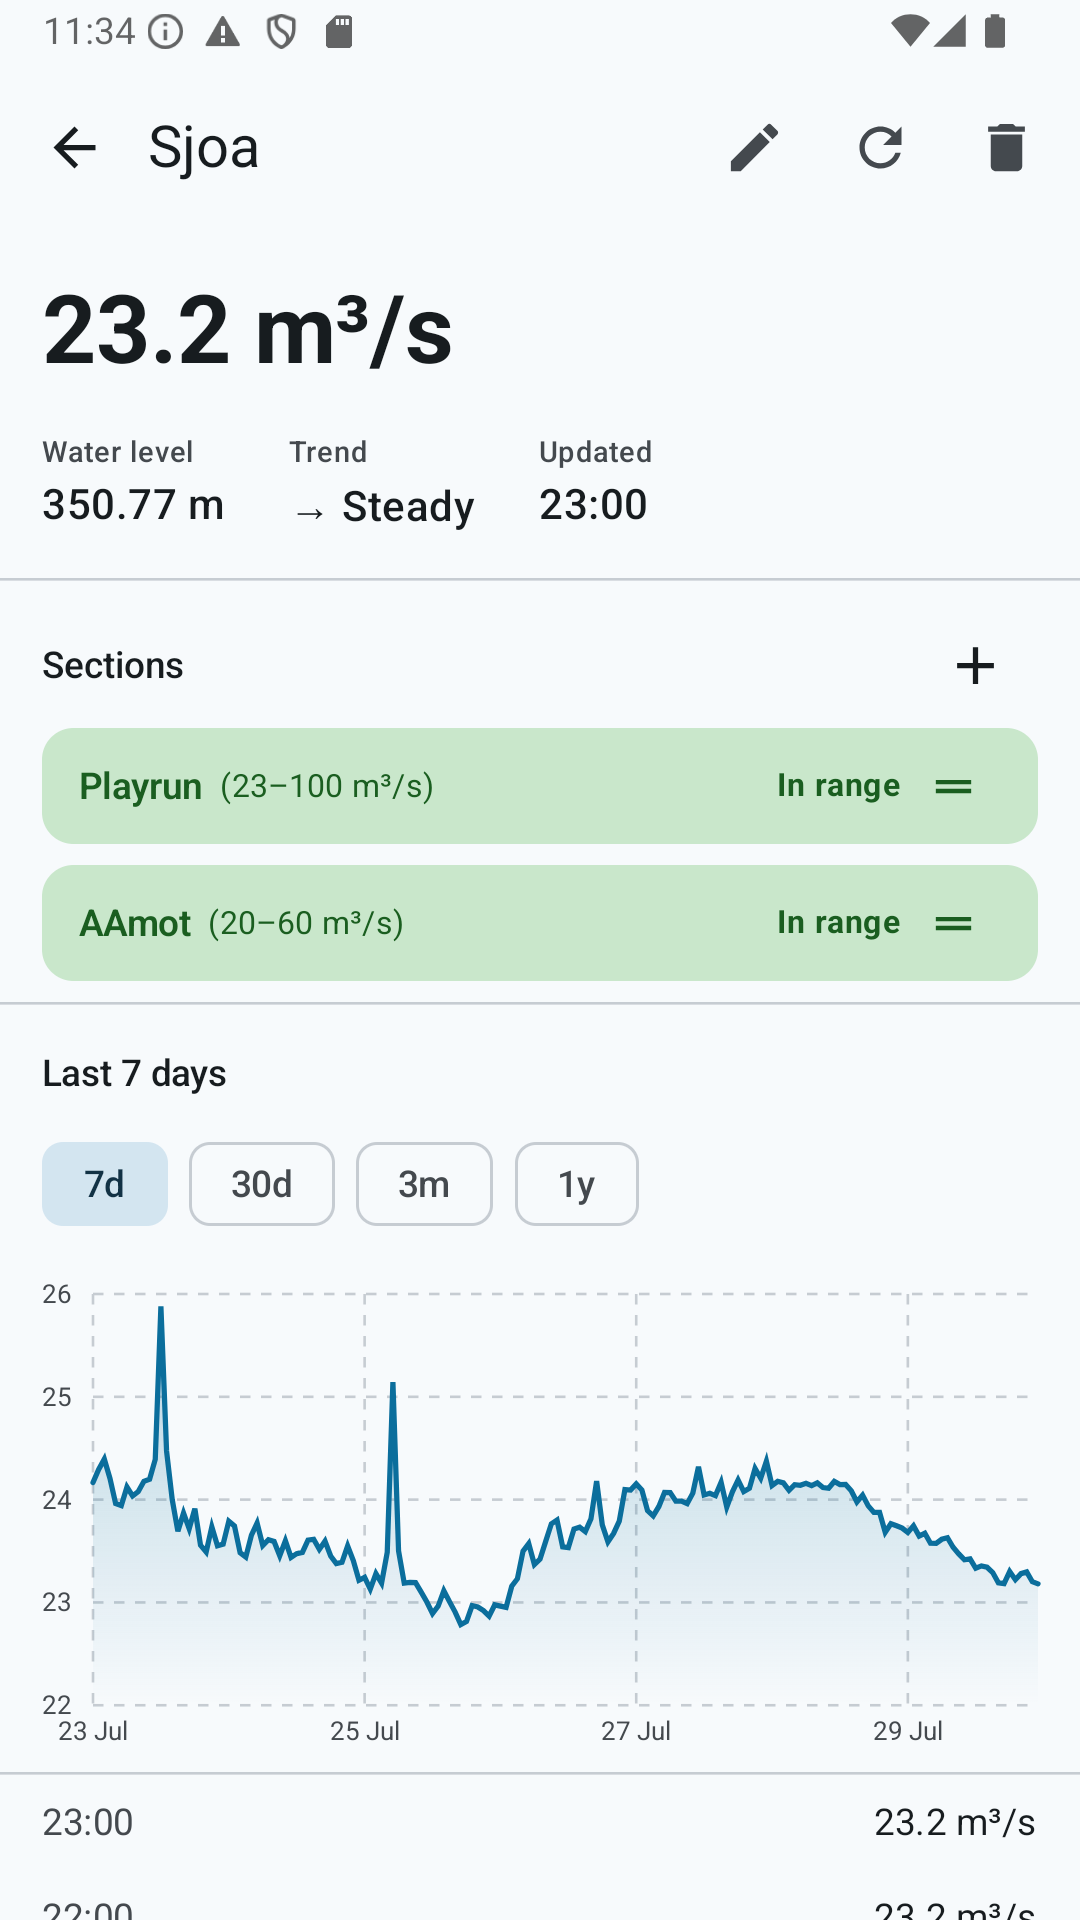
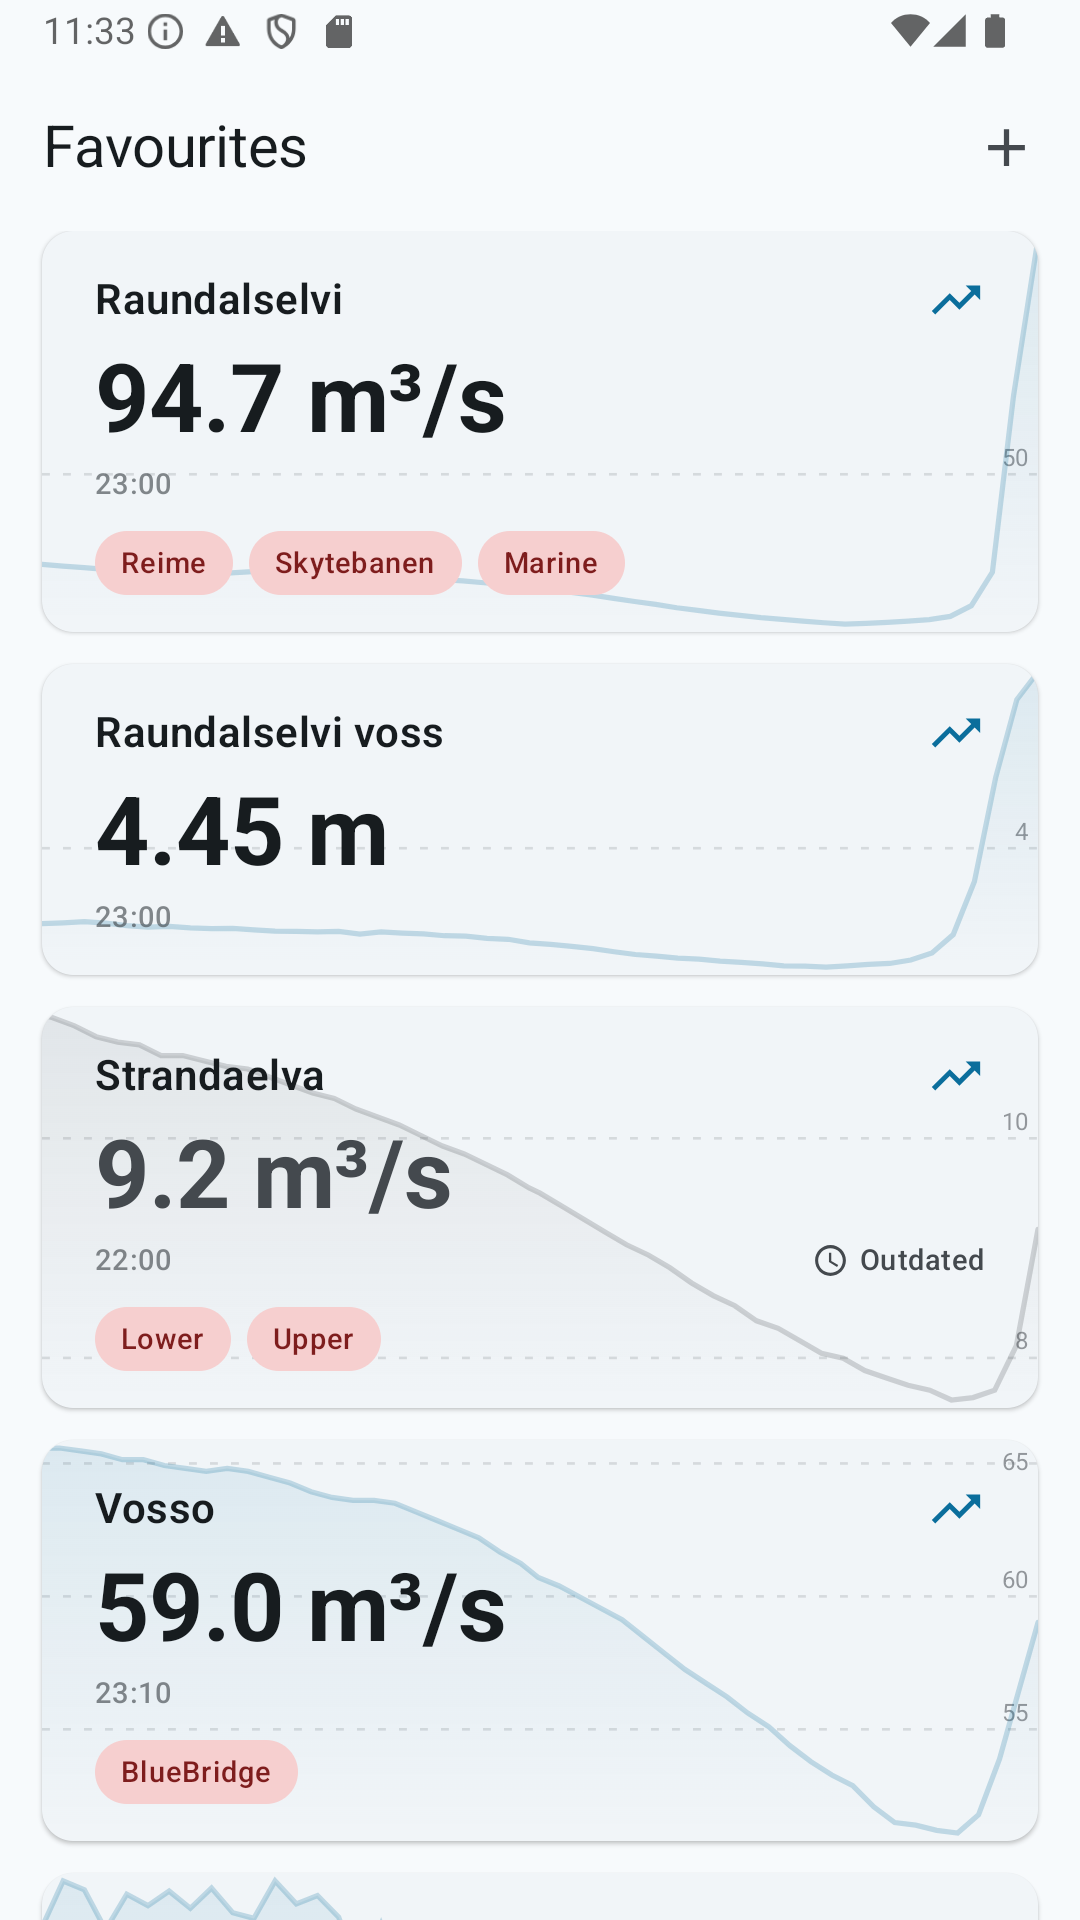
Your favourite rivers as cards: current discharge, a trend arrow, and a 48-hour trace behind the number, so you can see whether the river is rising, dropping or steady.

Runnable sections

Define your own stretches with the window they work in — “Canyon, 20–60 m³/s”. Green when it is in range, red when it is too low or too high.

Canyon Lower run Gorge · too high

Go/no-go on the front page

Every card carries its sections as chips, so “is anything runnable right now?” is answered without opening a single river.

Pick your window

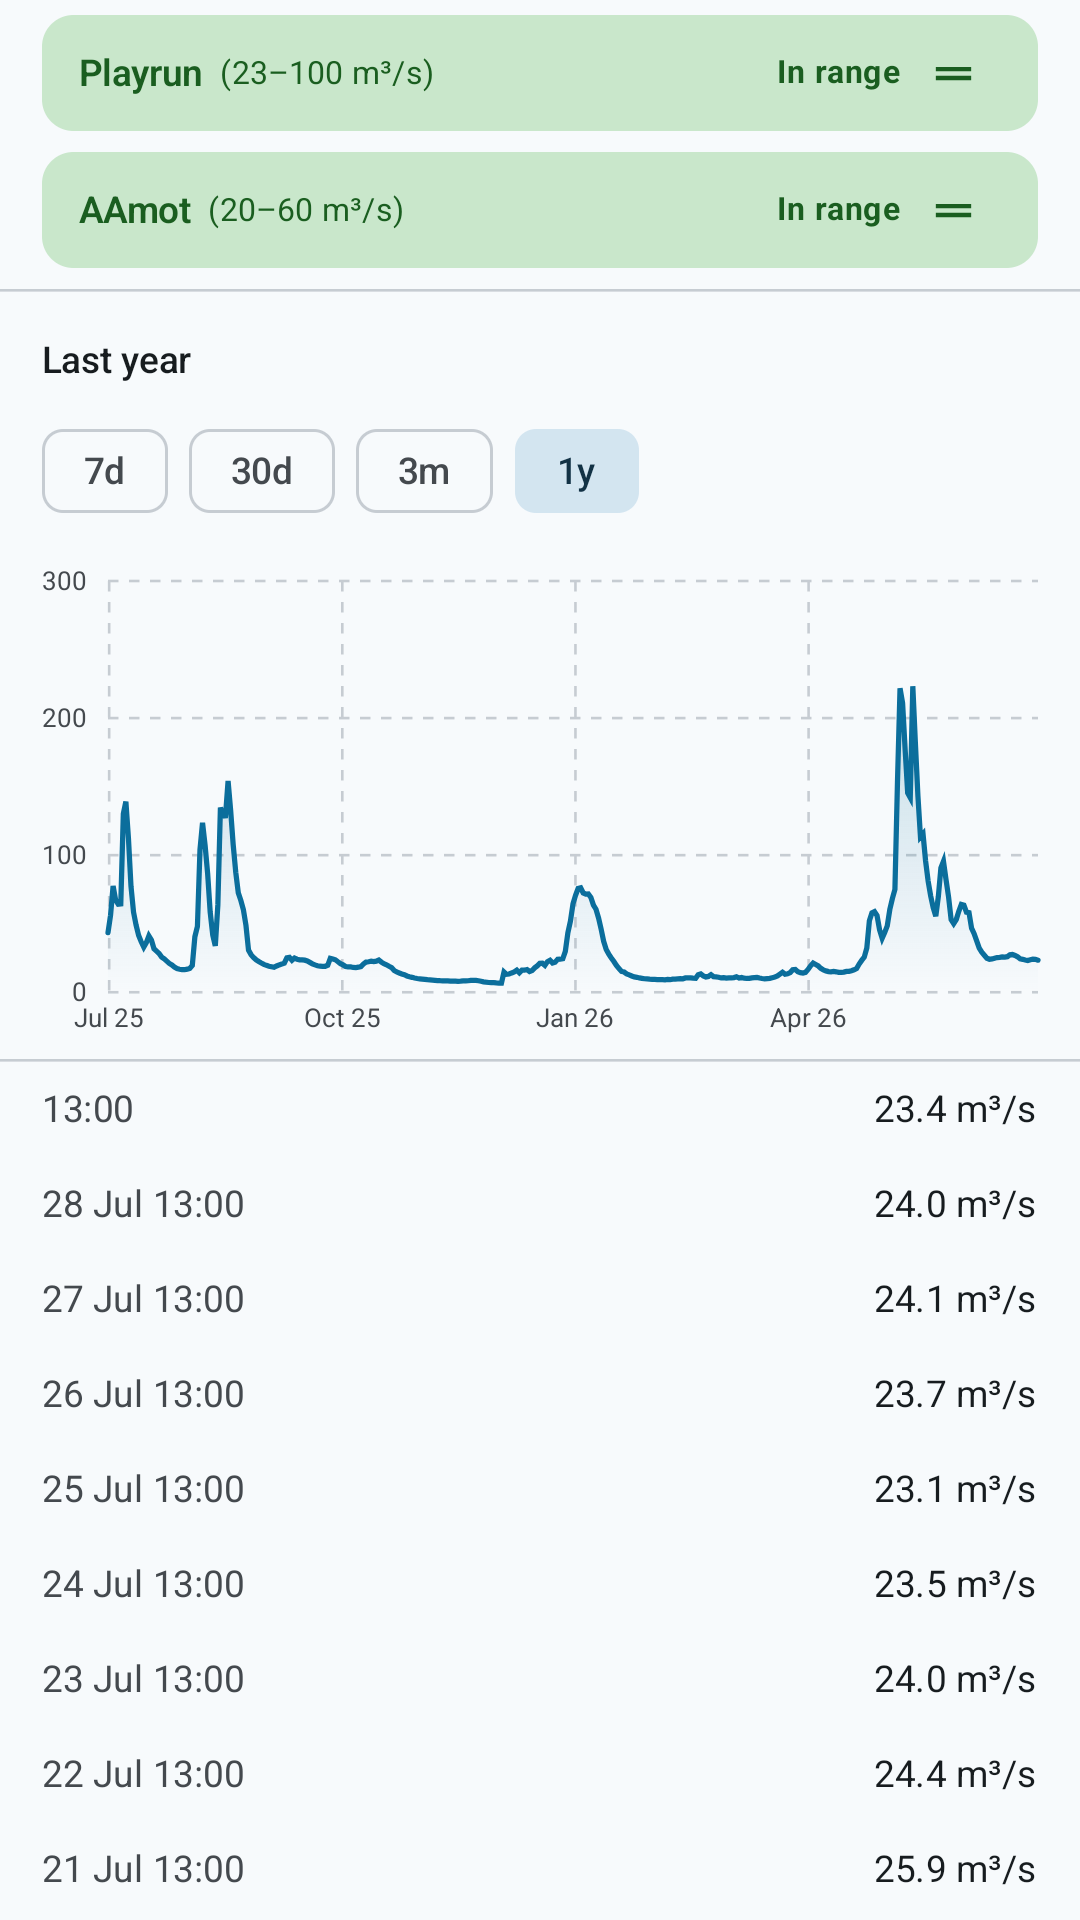
7 days, 30 days, 3 months or a full year. The year view shows the whole season — autumn rain, winter low water, the spring melt flood — so you can judge whether today is high or low for the time of year.

Home-screen widgets

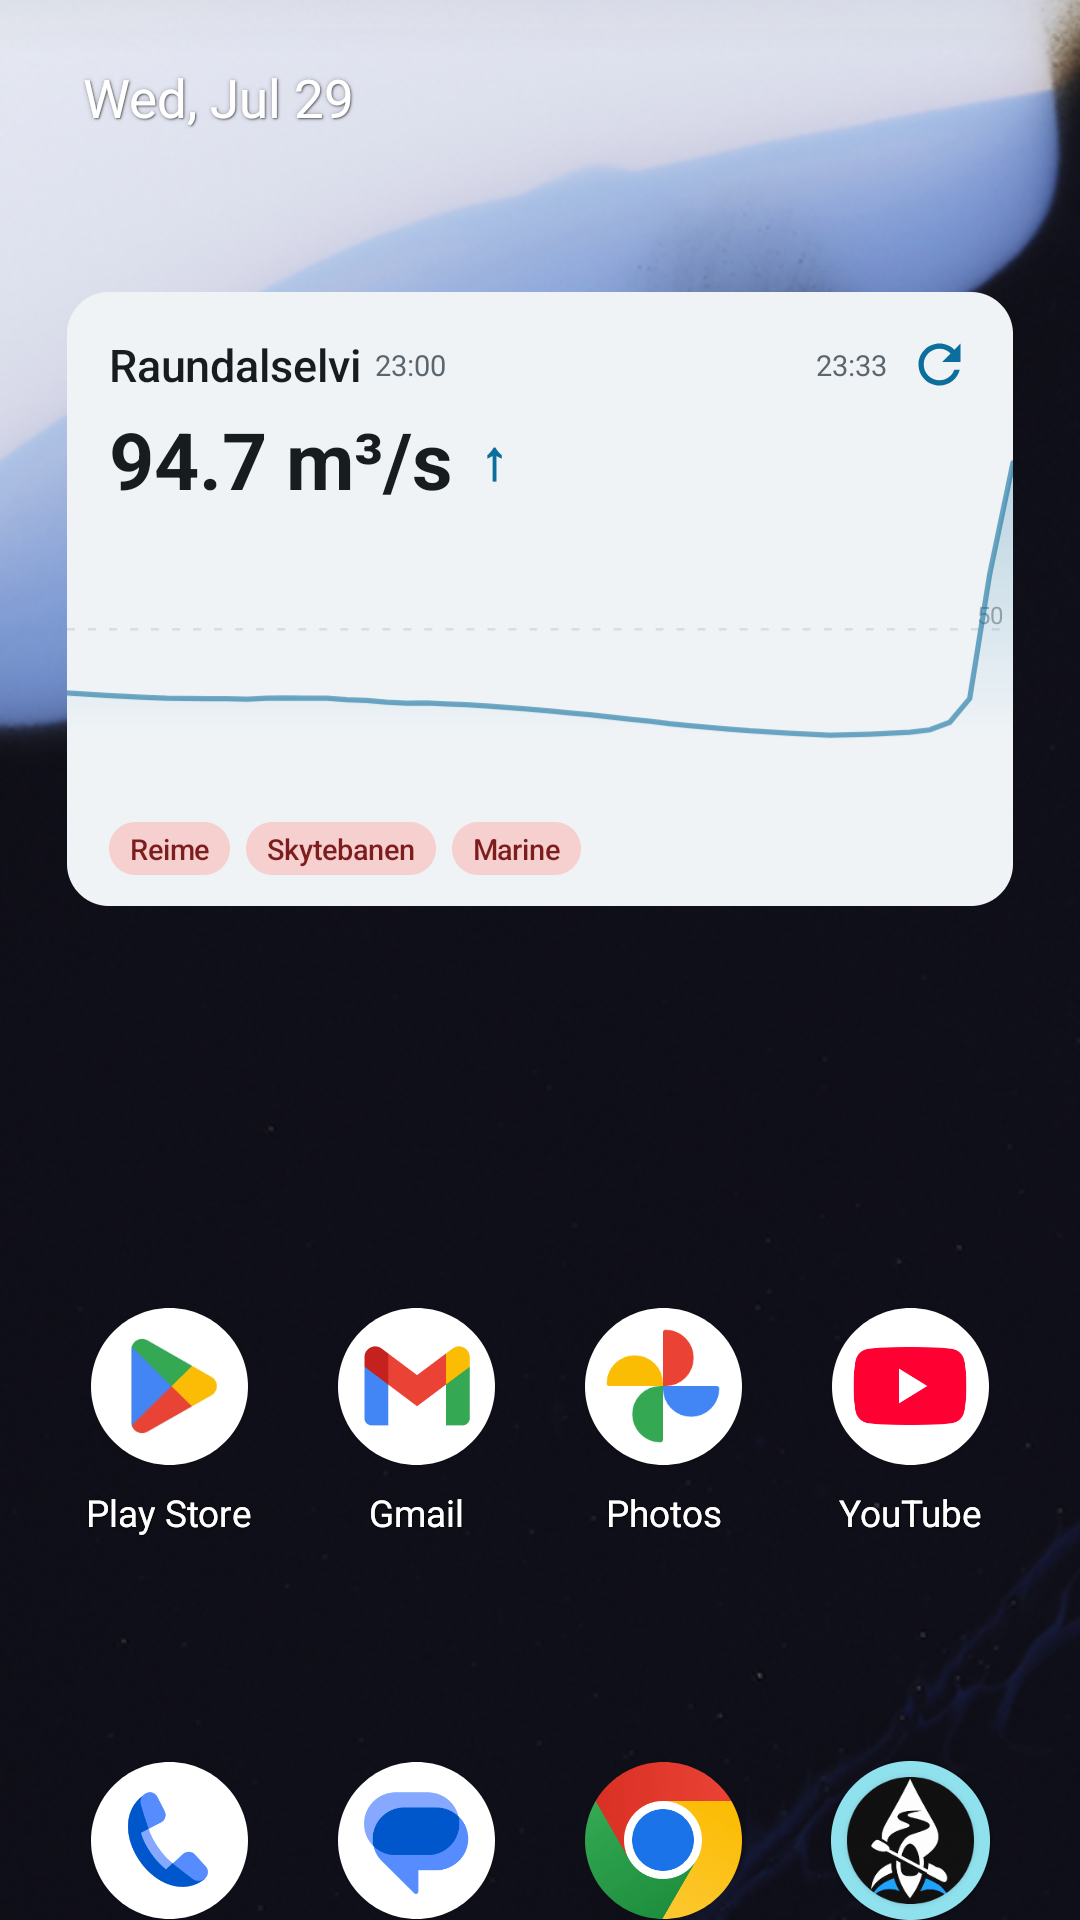
A single-river card widget you configure per placement, and a compact list widget with a go/no-go count for every favourite. Both follow your light or dark theme.

Android Auto

One river on the car screen with flow, level, trend and the go/no-go summary. Previous and next step through your favourites, and it reopens on the river you looked at last.

Your names, your order

NVE names gauges, not runs. Rename any river to what you and your mates call it, and drag the list into the order you actually paddle.

Honest about staleness

Two timestamps, never conflated: when NVE measured the water, and when the app last reached NVE. Readings older than 90 minutes are marked outdated rather than dressed up as live.
Screens

Scroll sideways. Captured on a phone, at real flows.

River detail screen showing discharge, level, trend and a 7-day chart
A river in detail: hero flow, trend, sections in range, and the chart window.
One-year chart showing seasonal variation in river flow
The one-year window — autumn rain, winter low water, the spring melt flood.
Favourites list with go/no-go chips and an outdated card
Favourites with go/no-go chips. Captured at high water, so the chips read “too high”.
Home-screen widget showing a single river
The card widget on a home screen, with both the measured and last-fetched times.

Where the data comes from

Every number in RiverPulse comes from the Norwegian Water Resources and Energy Directorate (NVE) hydrological API. Around 4,900 active stations across Norway are searchable, and you can add any of them. Stations that publish only water level work too, showing level as the headline figure instead of discharge.

River data © NVE, licensed under the Norwegian Licence for Open Government Data (NLOD). RiverPulse is not affiliated with or endorsed by NVE.

What it deliberately does not do

  • It is not a forecast. Everything shown is measured history, not prediction.
  • No alerts or notifications. The app will not tell you when a river comes into range; you open it and look.
  • Norway only. NVE covers Norwegian rivers, so that is the whole map.
  • No accounts, no ads, no tracking. Nothing to sign up for, and nothing collected — see the privacy policy.

Judgement stays yours

Flow figures describe a gauge, not a rapid. A number in range is not a guarantee that a river is safe to paddle: wood, ice, debris and changes since the last reading are all invisible to a measuring station. Scout, read the water, and make your own call.